by Federica Alfani[*], Fabio Clementi[†], Michele Fabiani[‡], Vasco Molini[§], Enzo Valentini[†]
Drawing on various macro- and micro-data sources, the authors present robust evidence of an inverted U-shaped relationship between female labour force participation and inequality. Overall, female labour force participation is found to have a strong and significant dis-equalizing impact in at least three groups of developing countries with relatively low initial levels of participation. A decile-level analysis shows that female labour force participation has higher levels of returns on income among top deciles of the income distribution compared with the lower deciles in the developing countries analyzed. This evidence focuses attention on the importance of developing policies specifically targeting women in lower deciles of the income distribution.
Introduction
Over the past few decades developing countries have seen a rapid increase in the number of women taking an active role in the labour market; however, this picture is highly heterogeneous. For many developing countries, increasing Female Labour Force Participation (FLFP) levels remains a priority (United Nations, 2000; World Bank, 2012), as well as a challenge because, as documented in this paper, increasing female participation in labour market in many of these countries can produce undesired distributional effects if it is not adequately combined with measures targeted towards women in the lower deciles of the income distribution. This effect tends to be stronger in contexts where FLFP is low and remains significant when participation increases but remains comparatively low.
Analyses to assess the impact of FLFP are typically conducted on a limited set of countries (Sotomayor 2009; Shin, 2010; Gornick et al., 2019); contrary to the approach taken in this work, they do not combine macro and micro data. The novelty of the present work is that it addresses the issue from these two different angles and combines different methodologies. As a first step, we estimate an inverted U-shaped relation between FLFP and inequality (with different specifications) at a pooled cross-sectional level and identify five rather homogeneous clusters of countries. Secondly, we test the U-shaped hypothesis with aggregated micro level data; notably, we expect that FLFP can both have a pro-equality or pro-inequality impact when regressed on household income inequality, depending on which regional blocs of countries, e.g. MENA, SA and LAC, a country belongs to. In these countries, the increase in FLFP will almost always have an inegalitarian impact, while, in other areas, e.g. North Europe, the effect is the opposite.
Data and methodology
The macro analysis is conducted using the World Bank’s Povcalnet database. The information from PovcalNet is combined with the World Development Indicators (WDI), which is the World Bank’s principal collection of development indicators compiled from officially recognized international sources. We proceed with a multivariate analysis to show the inverted U-shape relationship between FLFP and inequality. We follow a general formulation taken from the literature (Förster and Tóth, 2015). The scope of this regression is to show that the relation between FLFP and inequality is concave.
For the analysis based on micro data, disposable household income data was drawn from the Luxembourg Income Study (LIS). The countries’ data sets are harmonized into a common framework and contain household- and person-level data on labour income, capital income, pensions, public social benefits (excluding pensions) and private transfers, as well as taxes and contributions, demography, employment, and expenditures. Sixteen countries were selected (four developing and twelve developed countries), which were considered to be representative of the macro area of the world . We also conducted a preliminary analysis on a group of Middle East and North African (MENA) countries that was not included in the LIS data set, e.g. Morocco, Jordan and Egypt.
We empirically examine the implications of FLFP for household income inequality by means of a regression method based on the notion of “influence function”. Firpo et al. (2009) propose a simple modification in which the quantile is added back to the influence function, resulting in what the authors call the “re-centered influence function” (RIF).
One of the key concerns with the estimation framework described above is the potential endogeneity of FLFP due to omitted variable bias. Household income may indeed lead women to seek employment, or unobserved factors such as ability could drive women’s decision in favor of work. To address these issues, the strong assumption of FLFP being exogenous is relaxed, and an instrumental variable (IV) strategy is used to recover a causal interpretation. This choice is motivated by the observation that standard OLS estimates could be biased and inconsistent to the extent that FLFP is endogenous. As the proposed instrument, we chose women’s average wage by deciles from the past 10 to 30 years (depending on the country) for that income bracket. The idea to use this instrument follows the findings of Blau and Kahn (2007), who show how FLFP is conditioned by the wage women can aspire to while entering the labour market. The proposed average salary by decile is a market reference point that can condition the decision to participate in the labour market; however, depending on women’s ability it can be outpaced or not.
Results
As a matter of fact, our results confirm that the relationship between FLFP and inequality follows an inverted U-shaped. Therefore, if a country is located on the ascending part of the inverted U-shaped curve, increasing FLFP levels can lead to increasing inequality. This is the case in at least three groups of developing countries: the Middle East and North African (MENA), South Asian (SA) and Latin American and Caribbean (LAC) regions. With minor exceptions, these groups are clearly identifiable on the estimated curve, and countries within these groups present common features and a similar FLFP to the inequality gradient. While there is an extensive literature on the disequalizing impact of FLFP in developed countries, little has been written about developing countries, and to our knowledge this is the first empirical estimation of an inverted U-shaped relationship between FLFP and inequality.
Figure 1: Female Labour Force Participation and Gini index, all countries from 2002 to 2016. Each chart focuses on a different group of countries which is marked with red.
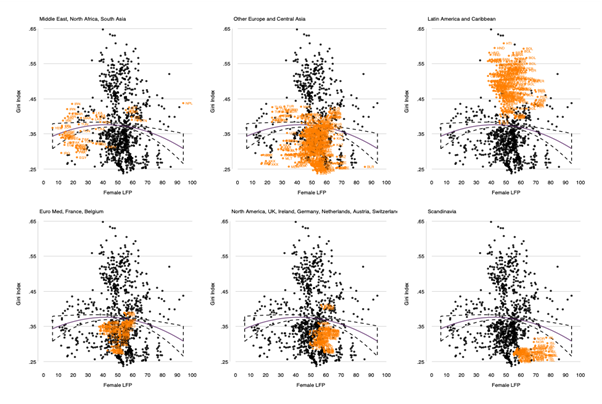
The picture is more heterogenous for developed countries, as shown by the quadrants in the lower row of Figure 1. For two of three country groups the gradient is negative, and positive for the remaining group. These three groups are the Scandinavians, with very high FLFP levels (the highest in the developed world) and low inequality; these countries are known for their very efficient and egalitarian fiscal policies and strong state support for working mothers. With a much lower level of FLFP (10 percentage points below the Scandinavians), but higher levels of inequality, include the following countries; the UK, the Netherlands, and Ireland, followed by the Euro-Mediterranean group, where FLFP is closer to that of Latin American countries (and in some cases lower, as in the case of Italy and Greece), but the inequality levels are much lower because they enjoy much more developed redistributive fiscal systems.
To strengthen our novel findings, we replicate these macro trends using household- and individual-level data. While micro-data are scarcer than macro-data, we were able to confirm the results from the macro analysis. Overall, the impact of FLFP is disequalizing in the developing countries under consideration. This is because the FLFP rate of return of the top two deciles of income is higher than that of the bottom two—although participation is higher among the top deciles of income. This shows that the increase in FLFP would have a strong pro-inequality impact, if not compensated with measures that favor women in the bottom deciles of income distribution. Among developed countries, the Scandinavian and the Euro-Mediterranean show higherFLFP returns in the lower deciles are higher than those in the higher ones, resulting in a pro-equality impact, while in the remaining group of European countries the dis-equalizing effect is prevalent. For the sake of brevity, only the results of the RIF-IV regression analysis for emerging countries will be presented (Table 1 and Table 2).
Table 1 looks at the impact of FLFP on income of individual deciles. Table 2 looks at both the impact on the two selected measures of inequality (P80/P20 and P90/P10 ratios). India, Morocco and Jordan all show a positive (inegalitarian) impact of FLFP on inequality. If we look at India, for example, the coefficient measuring the impact of FLFP on income of the top two deciles is almost double that of the bottom two, indicating that if not compensated with measures that favor women in the bottom deciles, the FLFP increase would dramatically raise inequalities. At the same time, the magnitude of the decile regression coefficients indicates that the gains obtained from an increase in FLFP on households’ income are huge for all deciles, probably due to the fact that participation is low. Conversely in LAC, FLFP is higher, and marginal increases would not have such a big impact on household incomes. At the same time, inequality is already high, and if countries want to further increase FLFP, they should consider the distributional impact; as in the previous case, targeted policies towards women in lower deciles seem to be the best available option to mitigate the trade-off between FLFP and the increase inequality.
Table 1: RIF-IV regression coefficients for the effect of female labour force participation on income, by country.
|
India |
Egypt |
Morocco |
Jordan |
Brazil |
Uruguay |
Chile |
|
|
Decile |
Coefficient |
Coefficient |
Coefficient |
Coefficient |
Coefficient |
Coefficient |
Coefficient |
|
1 |
72.76*** |
0.14 |
0.06 |
0 |
11.09*** |
7.66*** |
9.55*** |
|
[12.84] |
[0.14] |
[0.09] |
[0.01] |
[0.28] |
[0.32] |
[0.39] |
|
|
2 |
64.52*** |
-0.06 |
0.07 |
-0.01 |
9.88*** |
8.98*** |
7.58*** |
|
[11.35] |
[0.09] |
[0.06] |
[0.01] |
[0.22] |
[0.36] |
[0.30] |
|
|
3 |
72.88*** |
-0.04 |
0.15** |
0.03** |
10.59*** |
9.95*** |
8.10*** |
|
[12.82] |
[0.10] |
[0.06] |
[0.01] |
[0.21] |
[0.39] |
[0.32] |
|
|
4 |
79.69*** |
0.05 |
0.12** |
0.06*** |
10.08*** |
10.60*** |
7.44*** |
|
[14.02] |
[0.11] |
[0.05] |
[0.01] |
[0.21] |
[0.41] |
[0.29] |
|
|
5 |
91.56 |
0.09 |
0.15** |
0.08*** |
11.06*** |
10.53*** |
8.15*** |
|
[16.11] |
[0.12] |
[0.05] |
[0.01] |
[0.20] |
[0.41] |
[0.33] |
|
|
6 |
105.17*** |
0.17 |
0.19*** |
0.11*** |
10.70*** |
10.57*** |
8.26*** |
|
[18.50] |
[0.11] |
[0.05] |
[0.01] |
[0.20] |
[0.41] |
[0.33] |
|
|
7 |
126.08*** |
0.03 |
0.17** |
0.14*** |
11.55*** |
10.75*** |
8.62*** |
|
[22.19] |
[0.14] |
[0.06] |
[0.02] |
[0.24] |
[0.42] |
[0.35] |
|
|
8 |
148.90*** |
-0.08 |
0.31*** |
0.22*** |
14.42*** |
10.98*** |
11.29*** |
|
[26.20] |
[0.18] |
[0.06] |
[0.02] |
[0.24] |
[0.43] |
[0.45] |
|
|
9 |
197.48*** |
0.11 |
0.48*** |
0.31*** |
17.69*** |
11.67*** |
12.89*** |
|
[34.80] |
[0.22] |
[0.09] |
[0.04] |
[0.32] |
[0.47] |
[0.54] |
Notes: Robust standard errors in brackets; * p < 0.10, ** p < 0.05, *** p < 0.01.
Table 2: RIF-IV regression coefficients for the effect of female labour force participation on inequality, by country.
|
Percentile ratio |
India |
Egypt |
Morocco |
Jordan |
Brazil |
Uruguay |
Chile |
|
P90/P10 |
19.22*** |
0.00 |
0.05** |
0.05*** |
0.07 |
0.27*** |
0.11*** |
|
[3.48] |
[0.03] |
[0.01] |
[0.00] |
[0.04] |
[0.02] |
[0.03] |
|
|
P80/P20 |
13.64*** |
0.00 |
0.03** |
0.03*** |
0.22*** |
0.07*** |
0.32*** |
|
[2.42] |
[0.02] |
[0.01] |
[0.00] |
[0.02] |
[0.01] |
[0.02] |
Notes: Robust standard errors in brackets; * p < 0.10, ** p < 0.05, *** p < 0.01.
Conclusions
While there is almost unanimous consensus that increasing FLFP levels is an important developmental outcome—particularly in countries where FLFP levels are low and with high levels of gender discrimination—the translation of this general principle into effective policies becomes much more complicated. In certain contexts, fostering FLFP without considering its distributional impact can have potentially negative consequences in terms of inequality.
There are two good reasons why policy makers should consider this an important piece of information when formulating policies to increase FLFP levels.
First, these policies often require the usage of public resources, e.g. tax breaks or subsidies for companies employing women, financing of nurseries and schooling for children, targeted training programs for women’s insertion in the labour market, as well as offering publicly financed parental leave schemes (World Bank, 2012; Martınez and Perticara, 2017; Lopez- Acevedo et al., 2020). If not targeted, these policies can benefit women working in the formal sector, in urban areas, or with higher levels of education, thus contributing to increasing inequality. The paradox, therefore, is that public policies intended to reduce a certain type of inequality will increase another type of inequality.
Second and related to the previous point, the success of these policies is very much conditioned by their capacity to overcome deep-seated prejudices and social norms. One example of this is in the MENA region, where despite a rapid increase in women’s educational attainment, participation remains stubbornly low (Bandiera and Natraj, 2013). The difficulty of the task clearly requires broad coalitions, and the capacity to reach out to different social strata and constituencies.
References
Bandiera, Oriana, and Ashwini Natraj. 2013. “Does Gender Inequality Hinder Development and Economic Growth? Evidence and Policy Implications.” World Bank Research Observer 28: 2–21.
Firpo, Sergio P., Nicole M. Fortin, and Thomas Lemieux. 2009. “Unconditional Quantile Regressions.” Econometrica 77 (3): 953-73.
Firpo, S. P., N. M. Fortin, and T. Lemieux. 2018. “Decomposing Wage Distributions Using Recentered Influence Function Regressions.” Econometrics 6 (2): 28.
Förster, Michael F., and István G. Tóth. 2015. “Cross-Country Evidence of the Multiple Causes of Inequality Changes in the OECD Area.” In Anthony B. Atkinson and François Bourguignon (eds.), Handbook of Income Distribution (Vol. 2) (pp. 1729-1843). Amsterdam: North-Holland.
Gornick, Janet C., Berglind Hólm Ragnarsdóttir, and Leslie Mccall. 2019. The Interplay between Women’s Earnings and the Income Distribution: A Cross-National Analysis of Latin American and Anglophone Countries. Research Papers No. 105, Agence Française de Développement, Paris.
Lopez-Acevedo, Gladys, Samuel Freije-Rodriguez, Mexico Alberto Vergara Bahena, and Diego Cardozo Medeiros. 2020. Changes in Female Employment in Mexico: Demograph- ics, Economics, and Policies. Policy Research Working Paper No. 9292, World Bank, Washington DC. https://openknowledge.worldbank.org/handle/10986/33987.
Martınez A., Claudia, and Marcela Perticara. 2017. “Childcare Effects on Maternal Employment: Evidence from Chile.” Journal of Development Economics 126: 127–37.
Shin, Kwang-Yeong. 2010. The Effect of Labor Force Participation by Women on Family Income Inequality in Korea, Japan, and Taiwan.” Korean Social Science Journal, 37 (1): 27-55.
Sotomayor, Orlando J. 2009. Changes in the Distribution of Household Income in Brazil: The Role of Male and Female Earnings.” World Development 37 (10): 1706-15.
United Nations. 2000. Further Actions and Initiatives to Implement the Beijing Declaration and the Platform for Action. Resolution S-23/3 adopted by the General Assembly on 10 June 2000. https://www.un.org/womenwatch/daw/csw/outcome.htm.
World Bank. 2012. World Development Report 2012: Gender Equality and Development. Technical Report, World Bank, Washington DC. https://openknowledge.worldbank. org/handle/10986/4391.
[*] The World Bank Group, Tunis
[†] University of Macerata, Macerata
[‡] University of Campania “Luigi Vanvitelli”, Caserta. Corresponding author:
[§] The World Bank Group, Rome


